

Chart Kullanımı
Merhaba arkadaşlar bu makalemizde DataGridView satırlarındaki bilgileri Chart kullanarak grafiksel olarak göstereceğiz. Formunuza datagridview ve chart nesnesi ekleyin. Chart Series teki ismi personel olarak değiştirin.
Screenshot
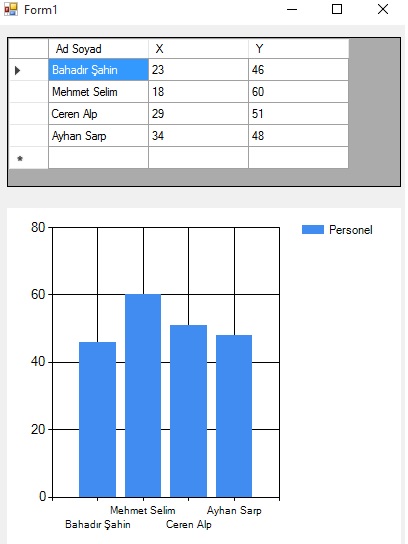
Şekil 1
Form1.cs
using System;
using System.Collections.Generic;
using System.ComponentModel;
using System.Data;
using System.Drawing;
using System.Linq;
using System.Text;
using System.Threading.Tasks;
using System.Windows.Forms;
namespace WindowsFormsApplication1
{
public partial class Form1 : Form
{
public Form1()
{
InitializeComponent();
}
DataTable table = new DataTable();
private void Form1_Load(object sender, EventArgs e)
{
try
{
table.Columns.Add("Ad Soyad", typeof(string));
table.Columns.Add("X", typeof(int));
table.Columns.Add("Y", typeof(int));
dataGridView1.DataSource = table;
bind();
}
catch (Exception ex)
{
MessageBox.Show("Hata oluştu!");
}
}
void bind()
{
table.Rows.Add("Bahadır Şahin", 23, 46);
table.Rows.Add("Mehmet Selim", 18, 60);
table.Rows.Add("Ceren Alp", 29, 51);
table.Rows.Add("Ayhan Sarp", 34, 48);
dataGridView1.DataSource = table;
for (int i = 0; i < dataGridView1.Rows.Count - 1; i++)
{
this.chart1.Series["Personel"].Points.AddXY(dataGridView1.Rows[i].Cells[0].Value.ToString(), Convert.ToInt32(dataGridView1.Rows[i].Cells[2].Value.ToString()));
}
}
}
}
Bir makalenin daha sonuna geldik. Bir sonraki makalede görüşmek üzere. Bahadır ŞAHİN