

Excel de Chart Oluşturma
Merhaba arkadaşlar, Bu makalemizde Excel sayfasında Chart gösterimini sağlayacağız.
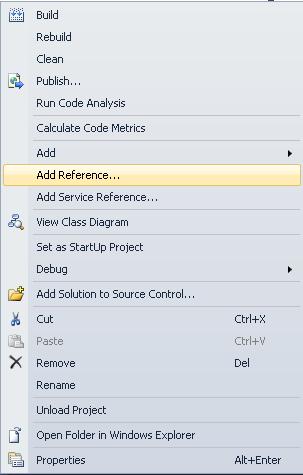
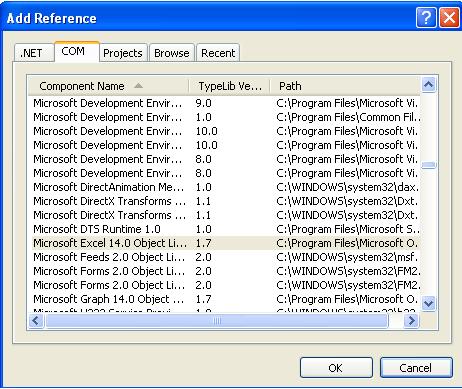
İlk önce Solution Explorer a sağ tıklayıp, Add Reference kısmından Excel componetini projenize ekleyin.


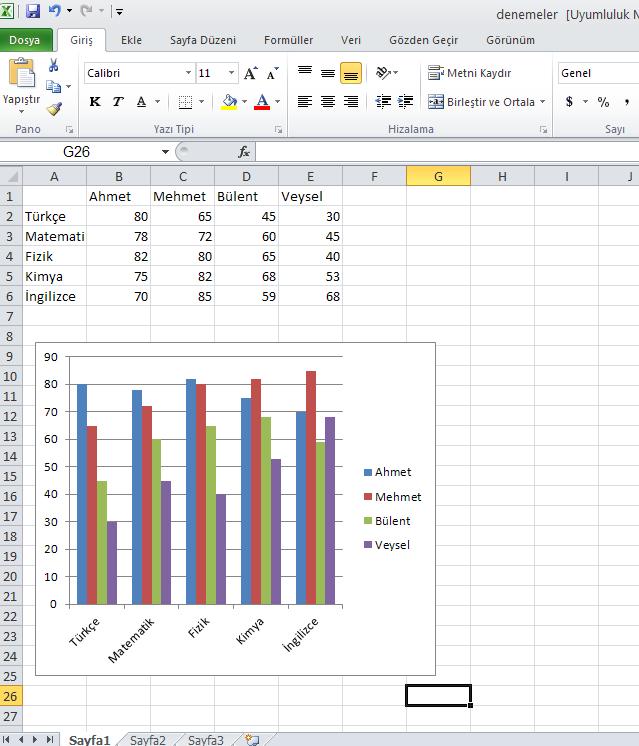
Aşağıdaki kodlarda görüleceği gibi Excel sayfasında tablo oluşturuyoruz. Tabloya girilen değerleri grafik olarak Chart ta gösterimini sağlıyoruz.


Form1.cs
using System;
using System.Collections.Generic;
using System.ComponentModel;
using System.Data;
using System.Drawing;
using System.Linq;
using System.Text;
using System.Windows.Forms;
using Excel = Microsoft.Office.Interop.Excel;
namespace WindowsFormsApplication1
{
public partial class Form1 : Form
{
public Form1()
{
InitializeComponent();
}
private void button1_Click(object sender, EventArgs e)
{
Excel.Application xlApp;
Excel.Workbook xlWorkBook;
Excel.Worksheet xlWorkSheet;
object misValue = System.Reflection.Missing.Value;
xlApp = new Excel.Application();
xlWorkBook = xlApp.Workbooks.Add(misValue);
xlWorkSheet = (Excel.Worksheet)xlWorkBook.Worksheets.get_Item(1);
//Oluşturulacak Excel tablosundaki
//verileri ekliyoruz
xlWorkSheet.Cells[1, 1] = "";
xlWorkSheet.Cells[1, 2] = "Ahmet";
xlWorkSheet.Cells[1, 3] = "Mehmet";
xlWorkSheet.Cells[1, 4] = "Bülent";
xlWorkSheet.Cells[1, 5] = "Veysel";
xlWorkSheet.Cells[2, 1] = "Türkçe";
xlWorkSheet.Cells[2, 2] = "80";
xlWorkSheet.Cells[2, 3] = "65";
xlWorkSheet.Cells[2, 4] = "45";
xlWorkSheet.Cells[2, 5] = "30";
xlWorkSheet.Cells[3, 1] = "Matematik";
xlWorkSheet.Cells[3, 2] = "78";
xlWorkSheet.Cells[3, 3] = "72";
xlWorkSheet.Cells[3, 4] = "60";
xlWorkSheet.Cells[3, 5] = "45";
xlWorkSheet.Cells[4, 1] = "Fizik";
xlWorkSheet.Cells[4, 2] = "82";
xlWorkSheet.Cells[4, 3] = "80";
xlWorkSheet.Cells[4, 4] = "65";
xlWorkSheet.Cells[4, 5] = "40";
xlWorkSheet.Cells[5, 1] = "Kimya";
xlWorkSheet.Cells[5, 2] = "75";
xlWorkSheet.Cells[5, 3] = "82";
xlWorkSheet.Cells[5, 4] = "68";
xlWorkSheet.Cells[5, 5] = "53";
xlWorkSheet.Cells[6, 1] = "İngilizce";
xlWorkSheet.Cells[6, 2] = "70";
xlWorkSheet.Cells[6, 3] = "85";
xlWorkSheet.Cells[6, 4] = "59";
xlWorkSheet.Cells[6, 5] = "68";
Excel.Range chartRange;
Excel.ChartObjects xlCharts = (Excel.ChartObjects)xlWorkSheet.ChartObjects(Type.Missing);
//Chartın konumunu, boyutlarını giriyoruz.
Excel.ChartObject myChart = (Excel.ChartObject)xlCharts.Add(10, 100, 300, 250);
Excel.Chart chartPage = myChart.Chart;
//Chart için Tablodaki sütunları seçiyoruz
chartRange = xlWorkSheet.get_Range("A1", "E6");
chartPage.SetSourceData(chartRange, misValue);
chartPage.ChartType = Excel.XlChartType.xlColumnClustered;
//excel dosyasını kaydediyoruz
xlWorkBook.SaveAs("denemeler.xls", Excel.XlFileFormat.xlWorkbookNormal, misValue, misValue, misValue, misValue, Excel.XlSaveAsAccessMode.xlExclusive, misValue, misValue, misValue, misValue, misValue);
xlWorkBook.Close(true, misValue, misValue);
xlApp.Quit();
releaseObject(xlWorkSheet);
releaseObject(xlWorkBook);
releaseObject(xlApp);
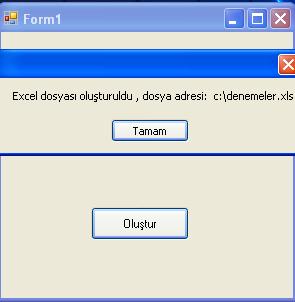
MessageBox.Show("Excel dosyası oluşturuldu , dosya adresi: c:\\denemeler.xls");
}
private void releaseObject(object obj)
{
try
{
System.Runtime.InteropServices.Marshal.ReleaseComObject(obj);
obj = null;
}
catch (Exception ex)
{
obj = null;
MessageBox.Show( ex.ToString());
}
}
}
}
Bir makalenin daha sonuna geldik. Bir sonraki makalede görüşmek dileğiyle. Hoşçakalın. Bahadır ŞAHİN